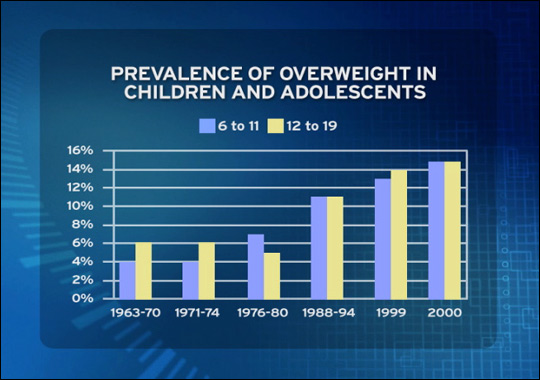
This chart from ("DiscoveryHealthCME :: Childhood Obesity :: Photos :: Charts." DiscoveryChannelCME :: Continuing Medical Education. N.p., n.d. Web. 1 June 2011.
| Years | Boys | Girls |
|---|---|---|
| 1966-1970 | 4.5 | 4.7 |
| 1971-1974 | 6.1 | 6.2 |
| 1976-1980 | 4.8 | 5.3 |
| 1988-1994 | 11.3 | 9.7 |
| 1999-2000 | 14 | 13.8 |
| 2001-2002 | 16.4 | 14.4 |
| 2003-2004 | 18.2 | 16 |
This graph is from (Obesity and CVD: Conceptual Model." National Heart, Lung and Blood Institute. N.p., n.d. Web. 1 June 2011). Childhood and adult obesity is rising. Obesity is determined by many factors including
I cannot believe the change in obesity rates. It's epidemic. I think this chart is the most convincing arguement. Nice work! Stay lean.
ReplyDelete